


It's the inequality, stupid!
How most US workers lost over $20,000 in earnings last year to Elon Musk and his cronies.


It’s difficult to think of a political catchphrase more well-known than “it’s the economy, stupid.” It originates from James Carville when he was a campaign strategist for Bill Clinton in 1992.1 Once again, the quote made the rounds during our most recent presidential campaign and extended into the winter after President Trump’s victory.
The Trump campaign talked a lot about the economy. They spoke about the high prices for groceries and gas and the overall economic malaise for the working class. The Democrats countered that inflation was on its way down and other economic fundamentals were strong. The employment rate was near record highs and GDP growth was sound. Yet, even many staunch Democrats didn’t really buy it. Economically, things just seemed too tough for too many people. It seemed as though the economic statistics didn’t match reality for many.
Yesterday I was made aware of an exercise undertaken by Carter Price who is a professor of policy analysis at Rand (a nonprofit, nonpartisan, research institute in California). He compared the US distribution of income from 1975 to what we have today. Then he asked a simple question, what would our economy look like today if we had the same income distribution that we had in 1975?
To set the stage for his result, compare the changes in GDP and inflation over time. Although there has been a bit of variance, US GDP (measured on a per worker basis) has grown at a remarkably consistent rate over the past half century. There are brief down turns during various recessions and of course during the early years of COVID-19, yet, GDP has been consistently strong. Inflation has been more volatile over this time period but even the high inflation of the past couple of years is far less than we had in the late 1970s.


(Graphs from Carter Price, available here.)
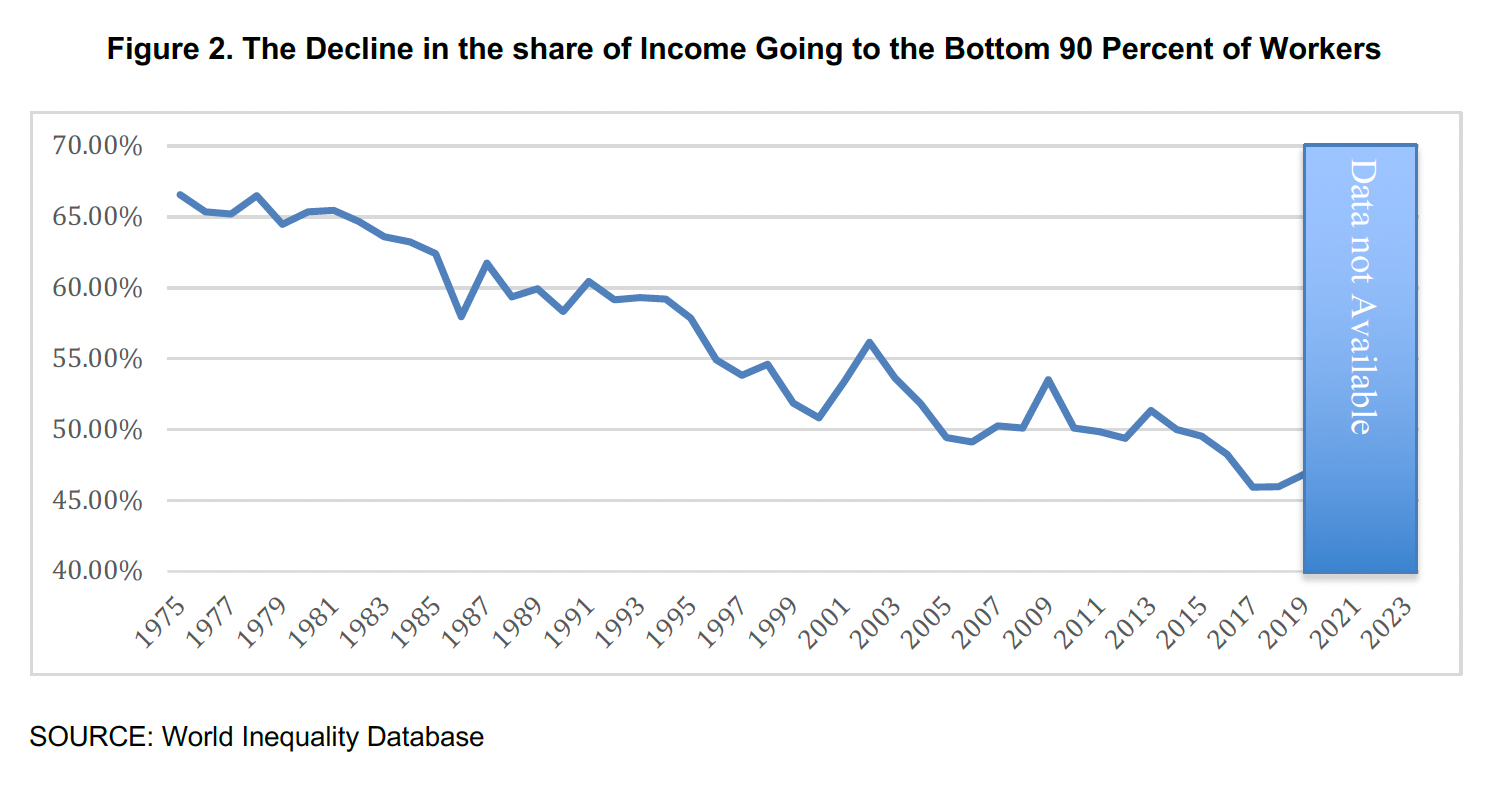
However, the distribution of the income that we earn has changed drastically. In 1975 the bottom 90 percent earned about two-thirds of all income. Today they earn less than half.
Price put pencil to paper (or actually keyboard to silicon) and calculated how much money had shifted from the bottom 90 percent to the top 10 percent each year from 1975 to 2023. If GDP and inflation had taken exactly the same paths over the past 48 years, but our income distribution had remained as it was in 1975, the bottom 90 percent of income earners would have made an additional $3.9 trillion in 2023! It’s an absurd sum of money. Imagine if the DOGE crew were actually able to find nearly $4 trillion dollars under a federal couch cushion. I think even President Trump would be shocked.
Price then calculated the sum of the income differences from 1975-2023. He found that holding the income distribution constant would have yielded an extra $79 trillion for the bottom 90 percent. Again, it’s an astounding total.
They are a few ways that we can think about in terms of how this money might have been distributed differently and what Price’s calculations mean for workers. Let’s consider a simple one. In total there are a little less than 164 million workers in the US today. If we were to divide the $3.9 trillion evenly across the lowest 90 percent of earners, these workers would each have taken home an additional $23,000 in 2023! Imagine how many economic ills that would cure!
The median income in the US was about $42,000 in 2023. So over half of workers in the US would have received more than a 50 percent raise. Even someone on the cusp of the top ten percent would notice a large bump in their pay. To be in this upper echelon of income earners you would need to make at least $170,000 per year. A raise of $23,000 would increase your income by about 13 percent. Not bad. What if someone earned $15 an hour in a full time minimum wage type job? This person would earn $31,200 per year if they worked 40 hours per week all year. Adding $23,000 to their earnings would change their financial life.
What about the $79 trillion total? Price calculated that $32 trillion of that total had occurred in just the five years from 2018-2023. This amounts to $195,000 per worker in that lower 90 percent category! The median home price in the US last year was $419,000. Everyone under the 90th percentile lost almost the equivalent of half of a house in just five years because of the change in the distribution of income!
Of course, this isn’t the only source of frustration among voters. And, it isn’t the only source of rising economic inequality. Access to healthcare is woefully unequal. Increasing costs of home prices, medical care and child care are hurting those at the bottom of the income distribution more than those at the top. We tend to focus on the rising costs. However, we see that a large part of our economic frustrations sit outside of the cost; the dramatic shift of income from the bottom to the top hurts people even more. Those at the top of the income distribution have taken money from those at the bottom and made necessities of life nearly unaffordable for many people.
Fixing this issue isn’t easy. Part of the problem comes from dwindling worker wages compared to corporate profits and executive wages. Other parts come from the ability of those with enough wealth to invest in the stock market and to leverage increasing wealth and equity from simple things like home ownership. There isn’t an easy solution to curtail our rising inequality but, as I wrote last week, a far more progressive tax system, like we had in the mid-20th century, certainly would help.
It should be clear that many of the policies that we are likely to see implemented in the coming year will worsen the problem of inequality. We know that the 2017 Trump tax cuts helped the wealthy at the expense of the common person. Forty-nine percent of the money saved from the tax cut went to households with income above $320,000 per year. Additionally, the tax cut didn’t trickle down to create a widespread economic stimulus that reached workers. On average anyone outside the top 10 percent of earners didn’t see an economic gain in wages from the tax cut.

It seems likely that Congress and President Trump are set to extend or enlarge similar tax cuts later this month. Further, to offset these tax cuts, we are likely to see decreases in important components of the social safety net. In particular, Medicaid will almost certainly see a significant reduction in funding. It provides health insurance to about one in five people overall, about two in five children and four in five children who live in poverty. Making health insurance unaffordable and reducing access to healthcare for lower income earners is only going to accelerate our path of increasing inequality.
Recalling James Carville from over 30 years ago, “it’s STILL the economy, stupid.” But now, how we decide to slice up the economic pie is even more important than the size of the pie. Those in the middle and at the bottom are hurting. The size of their slice is dwindling and those at the top are getting fat and taking a bigger and bigger portion for themselves. It is time to make our policies match our circumstances and stop taking steps to worsen the plight of those who are getting relatively less and less every single day. It isn’t the economy as a whole, it’s the inequality within it.
Troy Tassier is a professor of economics at Fordham University and the author of The Rich Flee and the Poor Take the Bus: How Our Unequal Society Fails Us during Outbreaks.
1. I have read that the Carville’s quote was actually, “The economy, stupid” but the amended quote has become the common catch phrase over time.
I don’t know anyone who wouldn’t feel a whole lot less stressed if they had an extra $20k every year. I’ve known about increasing inequality, but this really puts it in perspective.